
Big picture performance analysis using Lighthouse Parade
At 4/19/2024

There are great tools for doing performance analysis on a single web page. We use Lighthouse and WebPageTest for this all the time. But what if you want to evaluate the performance characteristics of an entire site? It is tedious to manually run a report for each page and then the output is a jumble of individual reports that have to be analyzed one-by-one. We recently created Lighthouse Parade to solve this problem.
Lighthouse Parade
Lighthouse Parade is a Node.js command line tool that crawls a domain and gathers lighthouse performance data for every page. With a single command, the tool will crawl an entire site, run a Lighthouse report for each page, and then output a spreadsheet with the aggregated data.
Under the hood, the tool is performing a combination of three tedious tasks:
- discovering all the URLs of a site,
- running Lighthouse reports for each, and
- aggregating the individual results from each page into a single spreadsheet.
Each row in the generated spreadsheet is a page on the site, and each individual performance metric is a column. This helps with high-level analysis because you can sort the rows by whichever metric you are analyzing.

Performance analysis workflow
Let’s go for a test drive! We’ll use npx, but you could also install the package globally.
Scan a site
Lately, I’ve been mesmerized by the Dallas-Fort Worth Freeways website (http://dfwfreeways.com/) because it reminds me of what the internet looked like at the very beginning of my career, so that’s what I’ll use for this demonstration. But you can pick any site you want. If you test with a smaller site, the scan will complete more quickly.
npx lighthouse-parade http://dfwfreeways.com/
Code language: Bash (bash)
The Lighthouse Parade has begun! You should see output in the terminal as the crawler discovers the pages of the site and runs Lighthouse reports on them.
Starting the crawl...
✔ http://dfwfreeways.com/
...
Aggregating reports...
DONE!
Code language: Bash (bash)
A new lighthouse-parade-data/ directory will be created in the current directory. When the scan completes, it’s contents should look like this:
2020-12-10T10_30_15/
    urls.csv
    aggregatedMobileReport.csv
    reports/
Code language: YAML (yaml)urls.csvis a spreadsheet with a row for each URL found by the crawler.reports/is a directory containing each individual Lighthouse report.aggregatedMobileReport.csvis a spreadsheet containing all the Lighthouse data insidereports/with each individual page report transposed into a row.
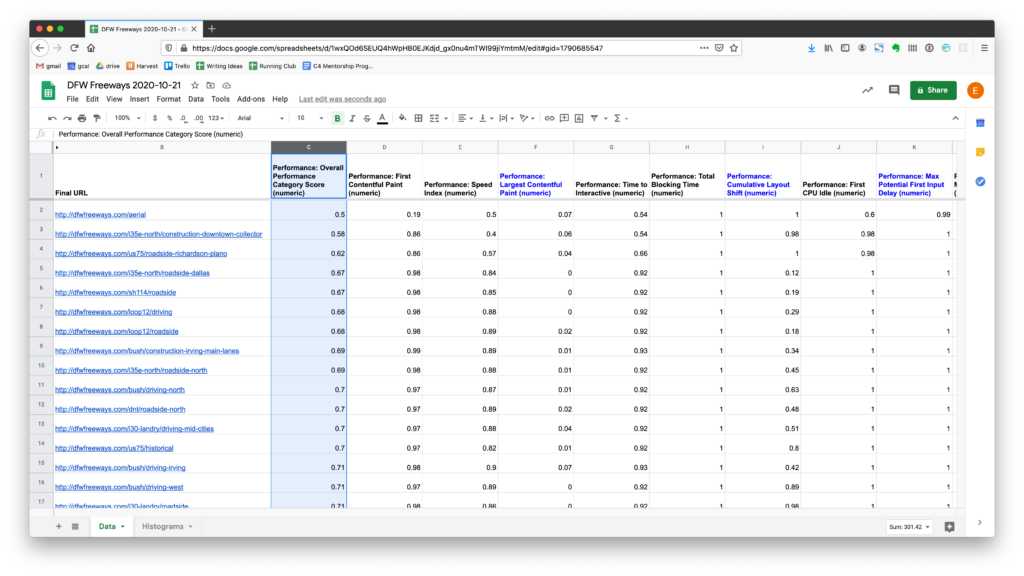
Now what? Let’s open the aggregated spreadsheet and look at some questions we can easily answer with this data. If you are not following along locally, you can also view the data in this public Google Sheet.
How well does the site perform, overall?
Each page’s overall Lighthouse performance score is in column C in our spreadsheet. Note that the spreadsheet data contains normalized scores, represented as a decimal between 0 and 1. So 1 is perfect and 0 is the worst. This may not feel intuitive at first, especially if you have experience looking at raw values (Example: 2.3 seconds). But the benefit of this abstraction is that 1 is always the best and 0 is always the worst, no matter which metric you are looking at in the report.
Let’s create a graph that will allow us to visualize all the data at once. A histogram is a chart that shows the frequency of values within a data set. Each bar represents a specific range. The height of the bars show the amount of data that falls in that range. So all we have to do is create a histogram from the data in column C. This is on the Histograms tab of the example Google Sheet. I’m not walking you through the individual steps to create a histogram because Google Sheets has great documentation elsewhere, and I’ve already created a template that will do this for you automagically. (We’ll come back to that.)
The following histogram shows the “shape” of the performance category scores for the entire DFWF site.

We can see from the cluster of tall bars on the right side that most of the pages perform well. But we also see a few short bars with lower scores to the left. Now that we have a general sense of how well the site performs, let’s dig a little deeper.
Which specific pages performed the worst?
There are many individual attributes that determine how performant a website is. The same process we are about to step through could be applied to study any of the data points provided by Lighthouse.
The histogram showed us that we have some pages that perform poorly, but it didn’t show us which pages were the culprits. We can answer this question with a few clicks in the spreadsheet by re-ordering the rows by that column. The way to do this will differ slightly between spreadsheet applications, but these are the instructions for sorting rows in a Google Sheet.
Now we can see precisely which pages were in the bars to the left side of the histogram.
Depending on your goals, you might focus on these lowest-scoring pages for further analysis. I often add a new column where I paste links to WebPageTest results for individual pages.
For a more comprehensive understanding of how a site is performing, I recommend repeating this procedure for each of the three core web vitals.

Spreadsheet template
Lighthouse Parade’s super power is its ability to compile performance data from an entire site into a single spreadsheet that is convenient for analysis. If you are not a spreadsheet ninja wizard, don’t worry. We made a Google spreadsheet template that you can import your data into. It includes several handy features:
- Basic formatting
- The three core web vitals columns are highlighted
- Histograms for each web core vital metrics are automatically generated
- Averages and median scores for the web core vitals are also calculated next to each histogram
We hope you find this tool useful. If you try it, please let us know what you think. And if you have questions or thoughts about how to make it better, we welcome your contributions.
